Customer and channel
Separate distributors, retail, hospitality, institutional, private-label or other channels by volume, pack format, price basis and payment terms.
Factory planning for water bottling projects
Test the economics before selecting equipment
A water bottling plant business plan should connect customers and net sales to equipment, operating costs and the cash needed to launch. Use the calculator to screen contribution and break-even, then check the monthly cash schedule and the factory capacity behind the forecast.
Answer first
Connect documented demand, net selling price, variable cost per sold bottle, fixed operating costs, invested capital and monthly cash timing. Start with contribution and break-even sales. Keep bottles produced, bottles sold and customer cash collected separate: an annual operating surplus does not prove that startup payments can be funded.
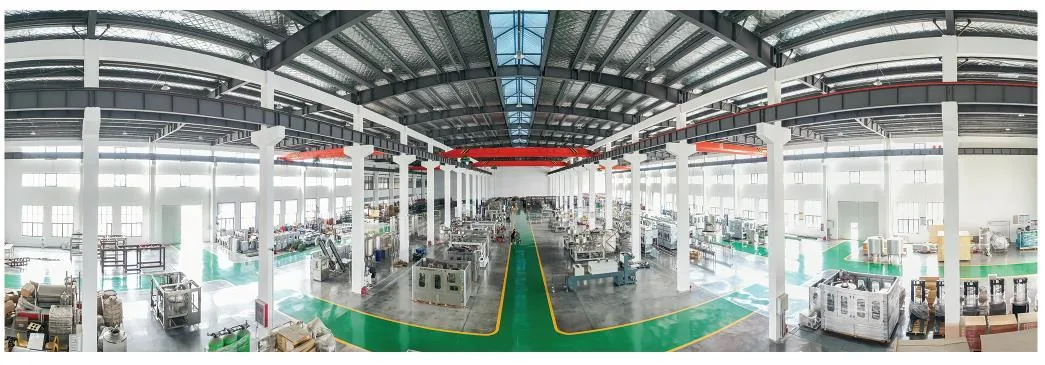
Equipment references from the 2026 catalog
These are representative Allot Tech catalog images. Final models, performance and interfaces remain project-specific and follow the signed technical scope.
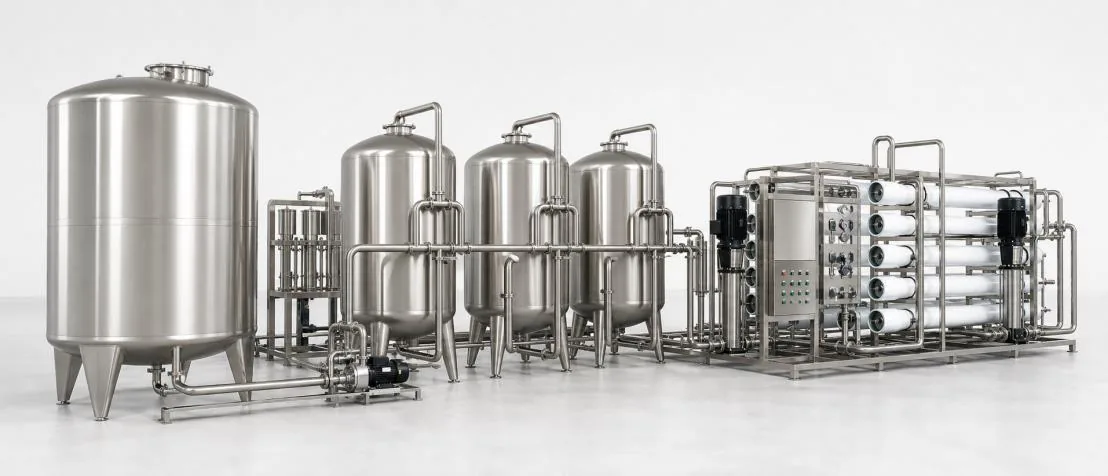
Raw-water evidence, product requirements, storage and sanitation define the treatment duty before a quotation is comparable.
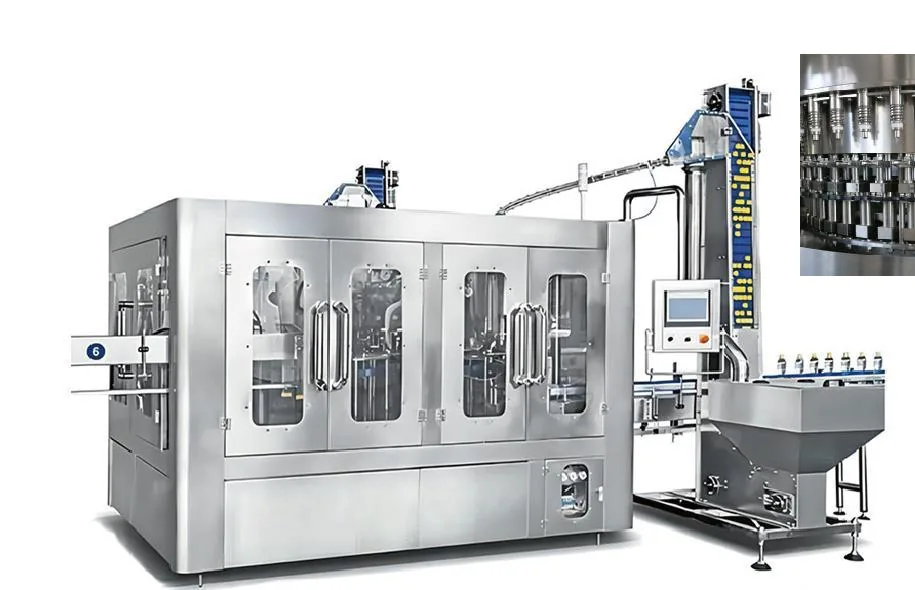
Bottle, cap, net output, materials, cleaning method and line interfaces must be tied to the selected filling configuration.
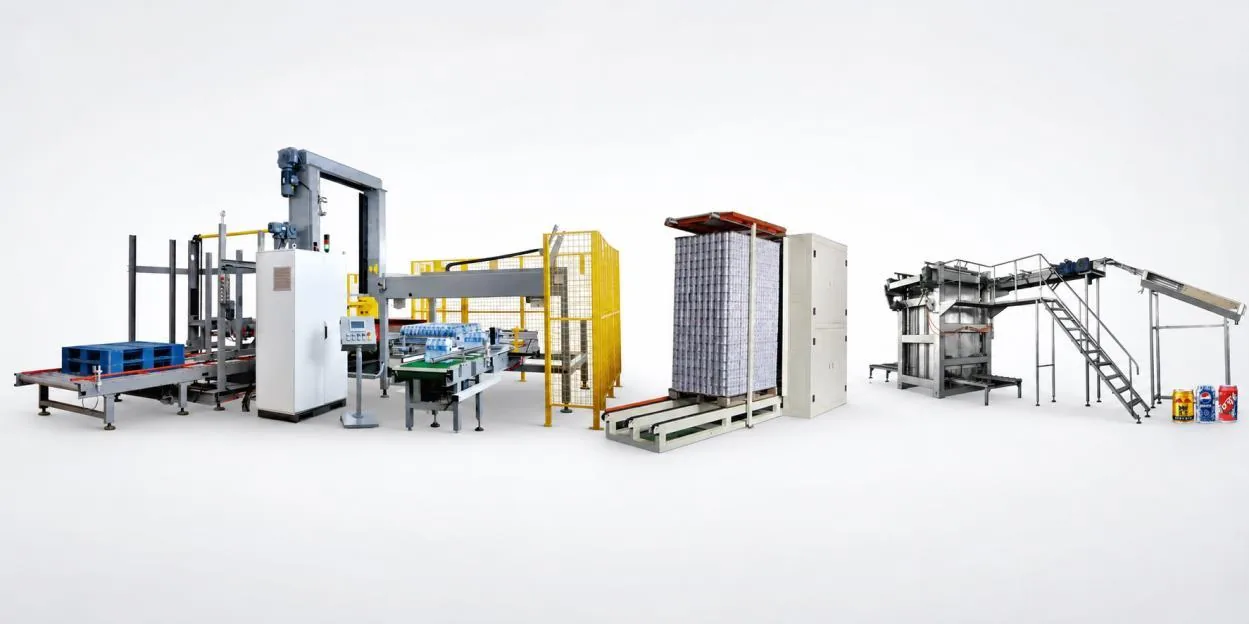
Labeling, packing, accumulation, pallet movement and warehouse flow must support the same saleable-output basis as the filler.
Input-based feasibility screen
Enter nonnegative figures in one currency and use bottles expected to be sold, not rated output or unsold production. Zero values stay visible so missing evidence is not hidden by invented benchmarks.
Input-based operating result
Enter project evidenceannual operating profit before tax, finance and depreciationOperating profit = sold bottles × (net price − variable cost) − fixed operating cost. Simple ROI = operating profit ÷ invested capital.
Volume sensitivity
The table holds price and costs constant and changes only annual saleable volume. Recalculate separate scenarios when pricing, mix or costs also change.
| Scenario | Sold bottles | Annual revenue | Operating profit | Simple ROI |
|---|---|---|---|---|
| Enter project evidence above. | ||||
Use the result correctly: this is a screening calculation, not a promise of profit or investment advice. Reconcile it with current quotations, working capital, monthly cash flow, tax, finance, replacement assets, permits and qualified local review.
01
Illustrative arithmetic only, using assumed currency units (CU). These are not water prices, supplier quotations or a profit forecast. Assume one bottle format, 1,200,000 bottles sold annually, 0.30 CU net price, 0.18 CU variable cost per sold bottle, 120,000 CU annual fixed operating cost and 240,000 CU total invested capital. Enter Other currency to reproduce it.
| Measure | Calculation | Illustrative result |
|---|---|---|
| Contribution per sold bottle | 0.30 − 0.18 | 0.12 CU |
| Break-even sold bottles per year | 120,000 ÷ 0.12 | 1,000,000 bottles |
| Annual operating result | 1,200,000 × 0.12 − 120,000 | 24,000 CU before tax, finance and depreciation |
| Simple annual ROI | 24,000 ÷ 240,000 × 100 | 10.0% |
| Simple payback | 240,000 ÷ 24,000 | 10.00 years if this annual result stayed constant |
| Interpretation | Sales exceed break-even by 200,000 bottles. | This margin can disappear if price falls, packaging cost rises or sales ramp up slowly. |
02
Show who buys the product and how the planned factory serves them.
Separate distributors, retail, hospitality, institutional, private-label or other channels by volume, pack format, price basis and payment terms.
Define product positioning, bottle and pack formats, label needs and the local steps required before sale.
Use base, downside and growth cases by month or season. Do not assume every produced bottle is sold immediately.
Estimate pallet, warehouse, vehicle, route, order-size and delivery-frequency needs alongside production.
03
Capacity and inventory should follow the sales and operating calendar.
| Model input | Question | Why it matters |
|---|---|---|
| Operating calendar | Days per year, shifts, hours, planned stops and seasonal pattern? | Converts annual volume into running hours |
| Utilization | What allowance is made for cleaning, changeover, maintenance, faults and ramp-up? | Prevents an unrealistic BPH requirement |
| Format mix | How much volume uses each bottle, label and pack? | Drives change parts, materials, inventory and line balance |
| Expansion trigger | Which measured demand or utilization level starts the next phase? | Prevents premature or late capital spending |
04
Keep assumptions traceable and update them when quotations or local data arrive.
Equipment, freight, duties, building, utilities, installation, laboratory, initial spares, permits and professional local work.
Packaging, treatment consumables, energy, water, labor, maintenance, testing, waste, rent or site cost and distribution.
Packaging inventory, finished-goods inventory, customer credit, supplier deposits, freight timing and startup cash reserve.
Test lower sales, higher packaging cost, lower utilization, delayed launch and additional local work rather than using only one optimistic case.
05
A schedule should expose decisions and dependencies.
List source, product, company, building, environment, utility, label and operating approvals that require local confirmation.
Set dates for requirement freeze, quotation comparison, technical agreement, drawings, FAT, shipment and site readiness.
Prepare staff, materials, utilities, laboratory, procedures, training, distribution and cash for the ramp-up period.
Assign owners to water, market, site, utility, supplier, shipping, permit, staffing and working-capital risks.
06
Continue the same illustrative case. The calculator sensitivity table changes sales volume only; for a packaging or distribution cost change, edit the variable-cost input and rerun the model. Hold fixed costs constant only while the assumed staffing and site arrangement remain valid.
| Scenario | Sold bottles/year | Contribution/bottle | Operating result/year |
|---|---|---|---|
| 70% sales; price and cost unchanged | 840,000 | 0.12 CU | −19,200 CU |
| Base sales | 1,200,000 | 0.12 CU | 24,000 CU |
| 130% sales; capacity and market still to verify | 1,560,000 | 0.12 CU | 67,200 CU |
| Base sales; variable cost rises from 0.18 to 0.20 CU | 1,200,000 | 0.10 CU | 0 CU — break-even moves to 1,200,000 bottles |
07
Use expected payment dates, not only invoice or production dates. Illustrative one-month check: 20,000 CU opening cash + 10,000 CU customer receipts − 35,000 CU payments = −5,000 CU before new financing. That month needs 5,000 CU to reach zero cash, plus any separately chosen minimum reserve. An annual profit calculation does not close this timing gap.
| Cash row | Input evidence | Avoid this mistake |
|---|---|---|
| Opening available cash | Prior month closing cash, excluding restricted funds. | Counting an undrawn facility as money already available. |
| Customer receipts | Order schedule, deposits, credit terms and realistic collection timing. | Treating all invoiced sales as same-month cash. |
| Equipment and local-work payments | Deposit, progress, shipment, installation and acceptance milestones. | Paying the same included service in two budget rows. |
| Operating and stock payments | Material purchase lots, payroll, utilities, rent, dispatch and other due payments. | Charging unsold stock only when it is eventually sold. |
| Financing and closing cash | Actual drawdowns, fees, debt service and locally reviewed tax timing. | Using simple payback as a monthly funding schedule. |
08
The worksheet is a screening model. A financing decision needs cash-flow timing, tax, debt service, depreciation, replacement capital and destination-specific professional review.
| Model layer | What this page covers | What remains project-specific |
|---|---|---|
| Operating screen | Contribution, break-even units, operating profit, simple ROI and simple payback | Monthly ramp-up, seasonality, receivables, inventory and cash timing |
| Capital basis | One entered total-investment value | Drawdown schedule, interest during construction, tax treatment and replacement assets |
| Risk review | Downside volume comparison | Market validation, permits, source risk, foreign exchange, logistics and execution delays |
| Investment appraisal | A transparent first-pass result | Discounted cash flow, financing structure and independent accounting or investment advice |
R
These sources support the calculation method. They do not supply a project price, profit forecast, tax result, financing recommendation or guarantee.
Primary small-business guidance on startup costs, fixed and variable costs, and break-even units. The examples on this page use stated assumptions rather than market forecasts.
Primary industrial-project reference explaining investment appraisal, operational cash flows and the need to evaluate inputs and outputs over a planning horizon.
Buyer questions
No. It provides the structure for a project-specific model. Prices, taxes, tariffs, market demand, finance and regulations must use current local evidence and qualified advice.
No. Start with demand, format mix and the operating calendar, then calculate the factory capacity needed under realistic utilization.
Common weaknesses include treating maximum line speed as saleable output, omitting working capital and local work, and assuming full demand from the first month.
Normalize them into the same scope and combine them with freight, local construction, utilities, installation, startup and operating assumptions.
For a single weighted-average saleable bottle, break-even units equal annual fixed operating cost divided by net selling price minus variable cost per bottle. Use separate models when formats or channels have materially different contribution.
No. A calculated ROI is only as credible as its demand, selling price, cost, investment and timing evidence. Test downside cases and reconcile the model with current local quotations, permits, tax, financing and cash-flow advice.
Use bottles expected to be sold in the modeled period. Production left in stock is not sales revenue. Model inventory purchases, storage and customer collections separately in the cash schedule; verify that the factory can make the required sales plus any planned stock change.
Move this project question forward
Share your bottle and pack mix, demand evidence and production calendar. The project discussion can check which equipment and site assumptions need verification before the business plan is finalized.
Not sure which data matters? Send what you have and state the decision you need to make.
Send target capacity and SKUs, source-water report, site utility schedule, building layout and required project milestones.
The project desk can identify missing inputs and a practical next step. Final engineering, configuration, compliance and commercial terms remain project-specific.
Allot Tech (Suzhou) Co., Ltd. · sales@allottech.com · Project telephone: +86 186 6213 1120 / +1 818 262 0958