How to Control Hardness, Silica and RO Scaling Risk
RO scaling control is a feed-water chemistry and concentration problem, not an antiscalant purchase. Obtain a complete, charge-balanced analysis from representative source conditions, then model how ions concentrate at the proposed recovery, temperature, pH and permeate flow. Identify credible mineral scales and silica behavior, test pretreatment or operating options, and confirm that antiscalant or acid choices are compatible with the membrane, product process, discharge route and applicable requirements. Define a test-derived operating envelope and leading indicators for intervention. EPA RO resources and supplier projections can support the study, but neither justifies a universal recovery, chemical dose, saturation limit or cleaning interval for every bottled-water source.
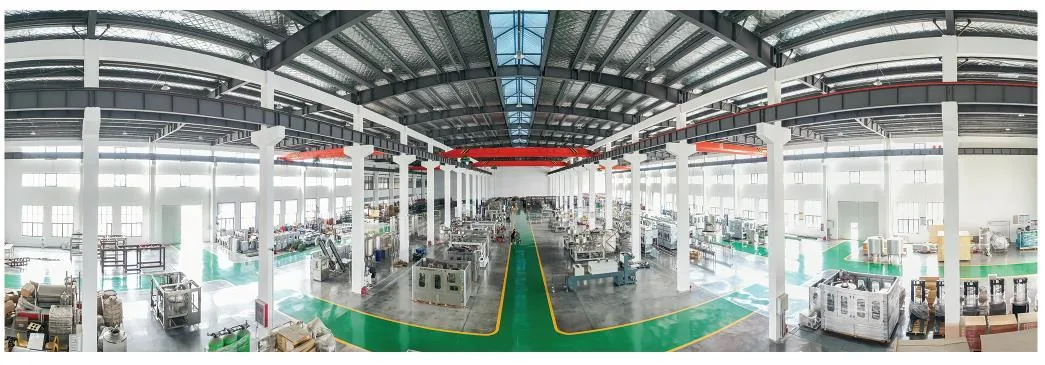
Real manufacturing reference from the Allot Tech Beverage Bottling Catalog 2026. Final equipment and layout remain project-specific.
01
Build a credible feed-water chemistry envelope
A projection is only as reliable as its inputs. Sample each source or blend across meaningful seasons and pumping states, using correct preservation and methods. Include ions and operating conditions needed for mass balance, electroneutrality review, scale prediction and downstream decisions. Flag results below quantification rather than silently converting them to zero.
Complete the ionic picture
Include calcium, magnesium, alkalinity species or appropriate basis, sulfate, chloride, silica, relevant metals, phosphate and other scale-forming or complexing constituents indicated by the source. Record pH, temperature, conductivity and TDS method. Review charge balance or laboratory consistency.
Represent variability
Map analyses to well state, rainfall or season, source blend, upstream treatment and storage. Use a design envelope rather than an average that hides a high-scaling event. Identify untested future sources as separate qualification work.
Account for chemical pretreatment
Include any coagulant, oxidant, pH adjustment, softener leakage, mineral addition or blend that changes feed composition. Model the water entering the membrane, not only the untreated laboratory sample.
Verify analytical fitness
Check units, dissolved versus total basis, preservation, silica method and detection range with the laboratory. A transcription or unit error can produce a confident but false projection. Retain reports and conversions in the design file.
02
Model concentration and identify the limiting scale mechanism
Evaluate the concentrate-side condition at candidate recovery and flux, not only feed concentration. Use a recognized projection tool with current membrane data and document version, assumptions and safety factors. Compare multiple operating cases and distinguish thermodynamic potential from the kinetics and residence time observed in the installed system.
Link recovery to concentrate chemistry
Create a water balance for feed, permeate and concentrate and calculate how rejection and passage affect each constituent. Include staged arrays and interstage concentration. Do not treat plant recovery as uniform concentration at every membrane element.
Screen relevant mineral scales
Evaluate carbonate, sulfate, phosphate, fluoride, metal and other scales supported by the analysis and chemistry. Select only relevant mechanisms. A single saturation index cannot represent all precipitates or silica behavior.
Treat silica separately where needed
Distinguish reactive or reported silica basis, temperature and pH effects, polymerization or co-precipitation possibilities, and interactions with metals or antiscalant. Use supplier and pilot evidence within the actual water envelope; avoid one universal silica ceiling.
Check fouling look-alikes
Colloids, oxidized metals, organics, biofilm and particulate loading may cause similar pressure or normalized-flow decline. Include appropriate pretreatment and diagnostic evidence so chemical dosing is not increased to solve the wrong mechanism.
Model case
Evidence input
Decision output
Required confirmation
Normal source
Representative chemistry and design operation
Expected scaling margin and control route
Commissioning normalized performance
Worst credible blend
Bounded high-risk ion and temperature case
Limiting recovery or pretreatment need
Targeted test or operating restriction
Pretreatment excursion
Leakage, dose or pH failure condition
Alarm and diversion requirement
Safe failure-mode challenge
Future source
Incomplete or provisional chemistry
Unqualified region of operation
Full analysis and new projection before use
03
Compare control strategies with lifecycle consequences
Options may include source segregation, recovery reduction, softening, selective removal, pH control, approved antiscalant or combinations. Compare them by validated capability, product and discharge effects, chemical handling, control robustness, residuals and total water use. The simplest dosing skid is not automatically the lowest-risk lifecycle choice.
Adjust recovery or staging
Test whether a lower recovery, different staging or permeate demand pattern creates an acceptable margin. Quantify concentrate and pretreatment consequences. Avoid raising recovery beyond the chemical envelope merely to improve a headline water-efficiency percentage.
Evaluate softening or selective pretreatment
Model leakage, regeneration, residuals, microbial control and source variability. Confirm that removing hardness does not leave silica or another constituent as the new limit. Include startup and regeneration transitions in the control plan.
Qualify pH or antiscalant control
Use the exact product, intended-use documentation, dose range, injection and mixing design, membrane compatibility, residual or discharge implications and supplier projection. Challenge loss, overfeed and empty-tank conditions. Do not publish a universal dose.
Pilot when uncertainty is material
Use representative water and meaningful recovery, flux and duration to observe normalized performance, pressure loss, concentrate condition and cleanability. A short bench run may screen chemistry but should not be presented as proof of long-term membrane life.
04
Operate within a normalized, evidence-based envelope
Commission with controlled instruments and baseline normalized data after the system is stable. Monitor feed chemistry and pretreatment state alongside pressure, flow, conductivity, temperature and differential pressure. Raw readings must be normalized or interpreted so seasonal temperature and demand changes are not mistaken for scale—or used to conceal it.
Set leading indicators
Define chemistry, hardness leakage, pH, dose verification, flow ratio, normalized permeate flow, salt passage and differential-pressure trends that indicate loss of margin. Establish project-specific warning and action logic from design and commissioning evidence.
Investigate before cleaning
Review instrumentation, source and pretreatment change, cartridge condition, biofouling, colloids and scale indicators. Inspect deposits or analyze cleaning return where appropriate. Repeated cleaning without mechanism diagnosis can shorten membrane life and hide the upstream cause.
Control affected water
After pretreatment failure or scaling excursion, divert or hold water according to the product-risk assessment, restore the operating envelope and verify membrane performance. A normal conductivity reading alone may not prove hydraulic recovery or absence of damage.
Reproject after change
Update the model for source, blend, pretreatment, antiscalant, membrane element, array, recovery, temperature or production-pattern changes. Preserve versioned inputs and approval. Supplier software output is evidence only for the assumptions entered.
R
References and verification boundary
These sources support the risk-control method on this page. They do not set project-specific legal limits, test frequencies, engineering values or approvals; verify the current edition and local applicability before a decision.
There is no universal value. Recovery depends on full feed chemistry, pretreatment, membrane design, temperature, flux, concentrate handling and validated operating evidence.
Can antiscalant replace a full water analysis?
No. Selection and dose require the ions and conditions that drive scale prediction. Missing chemistry makes the projection unreliable and may overlook incompatible risks.
Does softening eliminate silica scaling?
No. It can reduce hardness-related risk but silica and other mechanisms remain source- and process-dependent. Recalculate the complete concentrate chemistry after pretreatment.
Is every flow decline caused by scale?
No. Temperature, instrument bias, colloids, organics, particles and biofilm can produce similar symptoms. Use normalized data and mechanism-specific evidence before corrective action.
What evidence is needed for a scaling review?
Provide complete representative feed analyses, pretreatment and dosing details, membrane projection and array, operating logs, normalized trends, cleaning history, concentrate route and proposed recovery cases.
Move this project question forward
Need to resolve How to Control Hardness, Silica and RO Scaling Risk for your water bottling plant?
Options may include source segregation, recovery reduction, softening, selective removal, pH control, approved antiscalant or combinations. Compare them by validated capability, product and discharge effects, chemical handling, control robustness, residuals and total water use. The simplest dosing skid is not automatically the lowest-risk lifecycle choice.
Not sure which data matters? Send what you have and state the decision you need to make.
2. Attach the decision inputs
Complete the ionic picture
Link recovery to concentrate chemistry
Adjust recovery or staging
Set leading indicators
Send target capacity and SKUs, source-water report, site utility schedule, building layout and required project milestones.
3. Confirm the next planning step
The project desk can identify missing inputs and a practical next step. Final engineering, configuration, compliance and commercial terms remain project-specific.